Little leaves have big stories to tell about climate change. That’s a key takeaway of a new study that maps carbon-driven ecological change over millions of years and forecasts what current carbon trends could mean for the future.
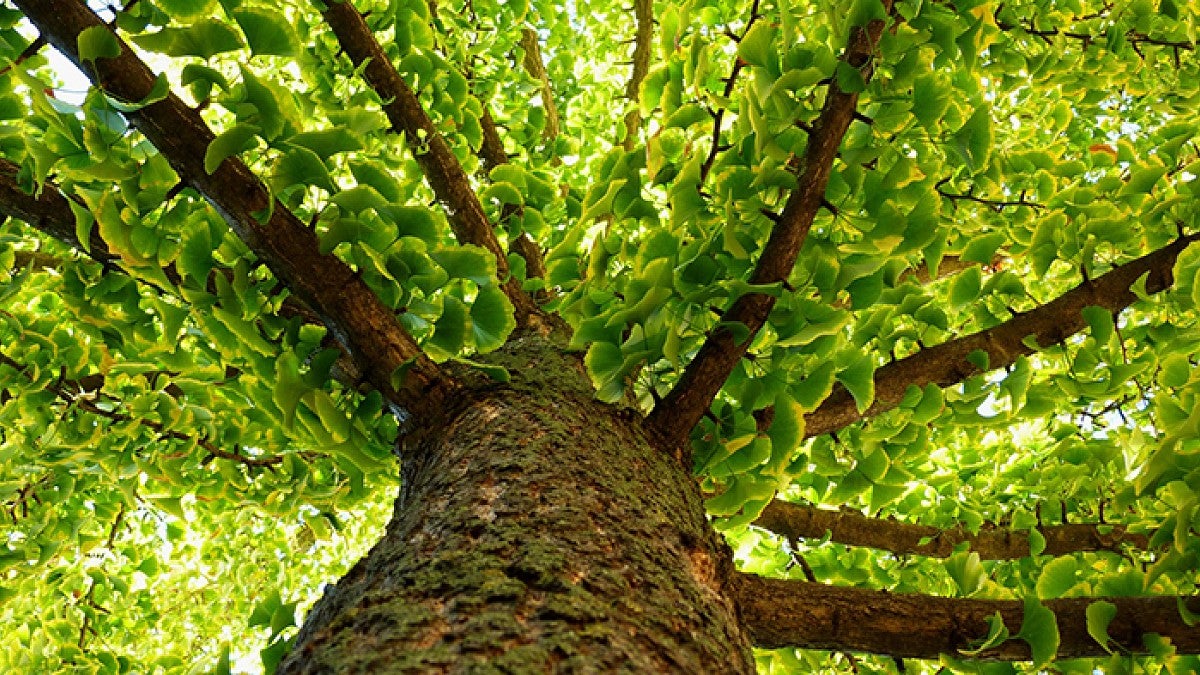
Authored by UO geologist Greg Retallack and graduate student Giselle Conde, the study, published online ahead of print in the journal Global and Planetary Change, examines modern and fossilized leaves of the Ginkgo biloba tree in an effort to reconstruct long-term changes in Earth’s atmospheric carbon levels.
The researchers zeroed in on small breathing pores, called stomata, which are present on Ginkgo and other deciduous leaves and allow plants to take up the carbon dioxide required for photosynthesis. Plants deploy fewer stomata in a carbon-rich atmosphere; as carbon levels drop, stomatal density increases, a pattern that makes these tiny structures useful for assessing carbon levels in past environments.

Beginning their study with historical herbarium specimens and associated carbon dioxide measurements, Retallack and Conde quantified the relationship between Ginkgo stomata density and atmospheric carbon over the last few hundred years.
“Our understanding of this relationship has been greatly helped by two recent events,” said Retallack, director of the Condon Fossil Collection at the Museum of Natural and Cultural History.
“One is the discovery in Kew Herbarium, near London, of a Ginkgo leaf picked in Japan in 1754, which offers a new baseline. The other is the rapid rise of carbon dioxide in the atmosphere over the past two decades, which constrains our calibration curve with unusual precision.”
With the calibration curve secured, the authors turned to fossils to reconstruct the past 300 million years of atmospheric carbon dioxide. They found that most of that period saw levels of 300 to 1,000 parts per million, overall a comfortable medium for supporting life, though ecosystems changed dramatically within that 700 ppm range.
Present-day Western Oregon, for example, was a subtropical forest 16 million years ago, when carbon levels reached 650 ppm, about 240 ppm above today’s levels. At the lowest levels of 180 ppm, glaciers crunched their way down half of North America, but as levels rose above 1,500 ppm, global weather havoc led to the greatest mass extinction in the history of life.
“There were also striking spikes of carbon dioxide above 1,500 ppm at other times of mass extinction, like the great dyings of 252, 200 and 66 million years ago,” Retallack said. “Each of these spikes ramped up quickly thanks to volcanic activity, and they came back down within a few hundred thousand years with the expansion of carbon-sequestering vegetation and soils.”
What does it all mean for our future?
“As atmospheric carbon levels pass the 400 ppm mark for first time in recorded history, we increasingly need a guide to carbon extremes and their ecological consequences,” Retallack said. “Studies like this one can help us prepare for coming ecological changes and perhaps inspire necessary action to avert a greenhouse crisis.”
—By Kristin Strommer, Museum of Natural and Cultural History


