


New research shows where water injustice plays out in the US
A new UO study identifies counties with the most severe drinking water quality violations
Story by Big Voice Communications
May 21, 2025
Roughly 2 million people in the United States do not have access to running water or indoor plumbing in their homes. Another 30 million people live in areas where drinking water systems violate safety regulations.
One University of Oregon researcher, along with co-authors, has mapped those hot spots in a first-of-its-kind study combining geospatial analysis with a cross-sectional, value-based survey. The study sheds light on water privatization in the U.S. and explores how different water systems affect equitable access and people’s perceptions of clean drinking water.
Alex Segrè Cohen, assistant professor of science and risk communication, hopes that lawmakers will apply the research to improve clean water access and quality of life.
“Policymakers can use our findings to identify and prioritize enforcement efforts in hot spots, make improvements in infrastructure, and implement policies that ensure affordable and safe drinking water, particularly for socially vulnerable communities,” said Segrè Cohen, the paper’s lead author. “We found that violations and risks of water injustice tend to cluster in specific areas or hot spots across the country.”


Alex Segrè Cohen
Alex Segrè Cohen
Segrè Cohen and her collaborators devised a county-level water injustice score by integrating multiple data sources to evaluate drinking water access and risk across the contiguous United States. Researchers used data from the U.S. Environmental Protection Agency’s Safe Drinking Water Information System, which summarizes reporting from states on all public water systems, which serve roughly 90 percent of American households.
The paper’s analysis focused specifically on community water systems that supply water to the same population year-round, distinguishing between private systems and public systems owned by federal, state or local governments or tribes. Researchers also collected social vulnerability data from the Environmental Justice Index maintained by the U.S. Centers for Disease Control and the Agency for Toxic Substances and Disease Registry, combined with indicators from the U.S. Census Bureau’s American Community Survey.
Those datasets were merged with a nationally representative 2019 survey of U.S. residents that assessed perceptions of access, quality and reliability of local water systems, among other indicators of water injustice.
The researchers defined water injustice as the unequal access to safe and clean drinking water that disproportionately affects low-income households and people of color. Each community was assigned a water injustice score from 0 to 1, with 1 indicating the highest risk of exposure to water-related inequities.
“This is one of the first studies to bring together quantitative data on water system violations with people’s lived experiences and social vulnerability, Segrè Cohen said. “We designed our method to capture not just where the problems are, but who they impact most and how. That combination of geospatial analysis from federal datasets and public perceptions from a survey gives us a much more powerful lens for understanding water injustice in the U.S.”
Catherine Slavik, a Banting Postdoctoral Research Fellow at the UO, co-authored the research.
The study showed that the top 10 counties with the highest ranking for water violations were in West Virginia, Pennsylvania, North Carolina and Oklahoma. Standing out among them was Wyoming County, West Virginia, which had the highest number of violations in a single water system.
Water system violations included failures to comply with regulations under the Safe Drinking Water Act and health-based violations such as exceeding maximum levels of contaminants, noncompliance with mandated water treatment techniques, and failure to follow monitoring schedules and communicate required information to system users.

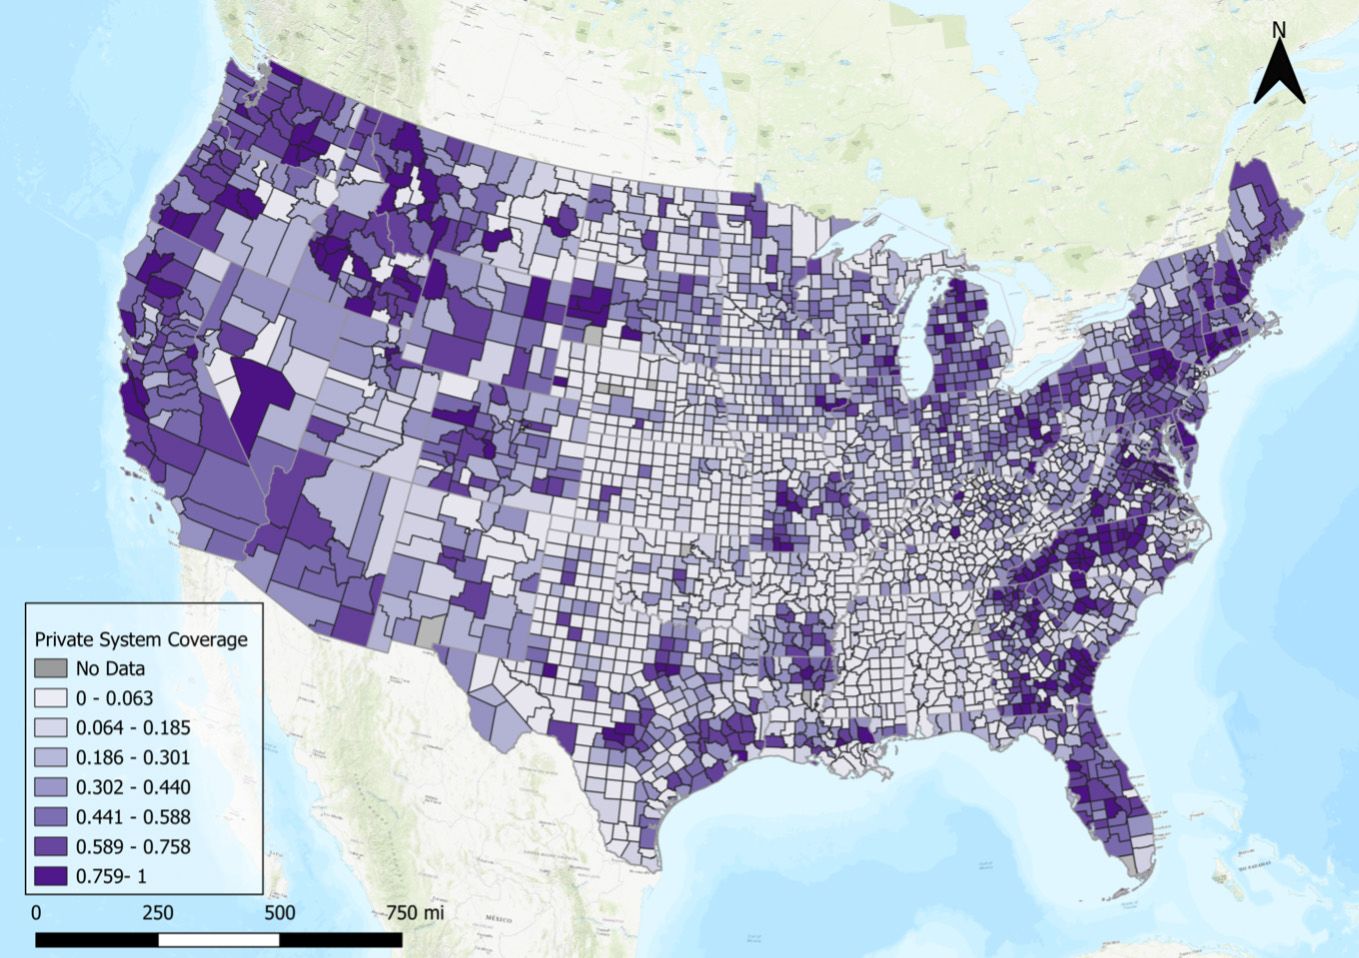
Proportion of private drinking water systems by U.S. county. Source: EPA SDWIS (2019).
Proportion of private drinking water systems by U.S. county. Source: EPA SDWIS (2019).

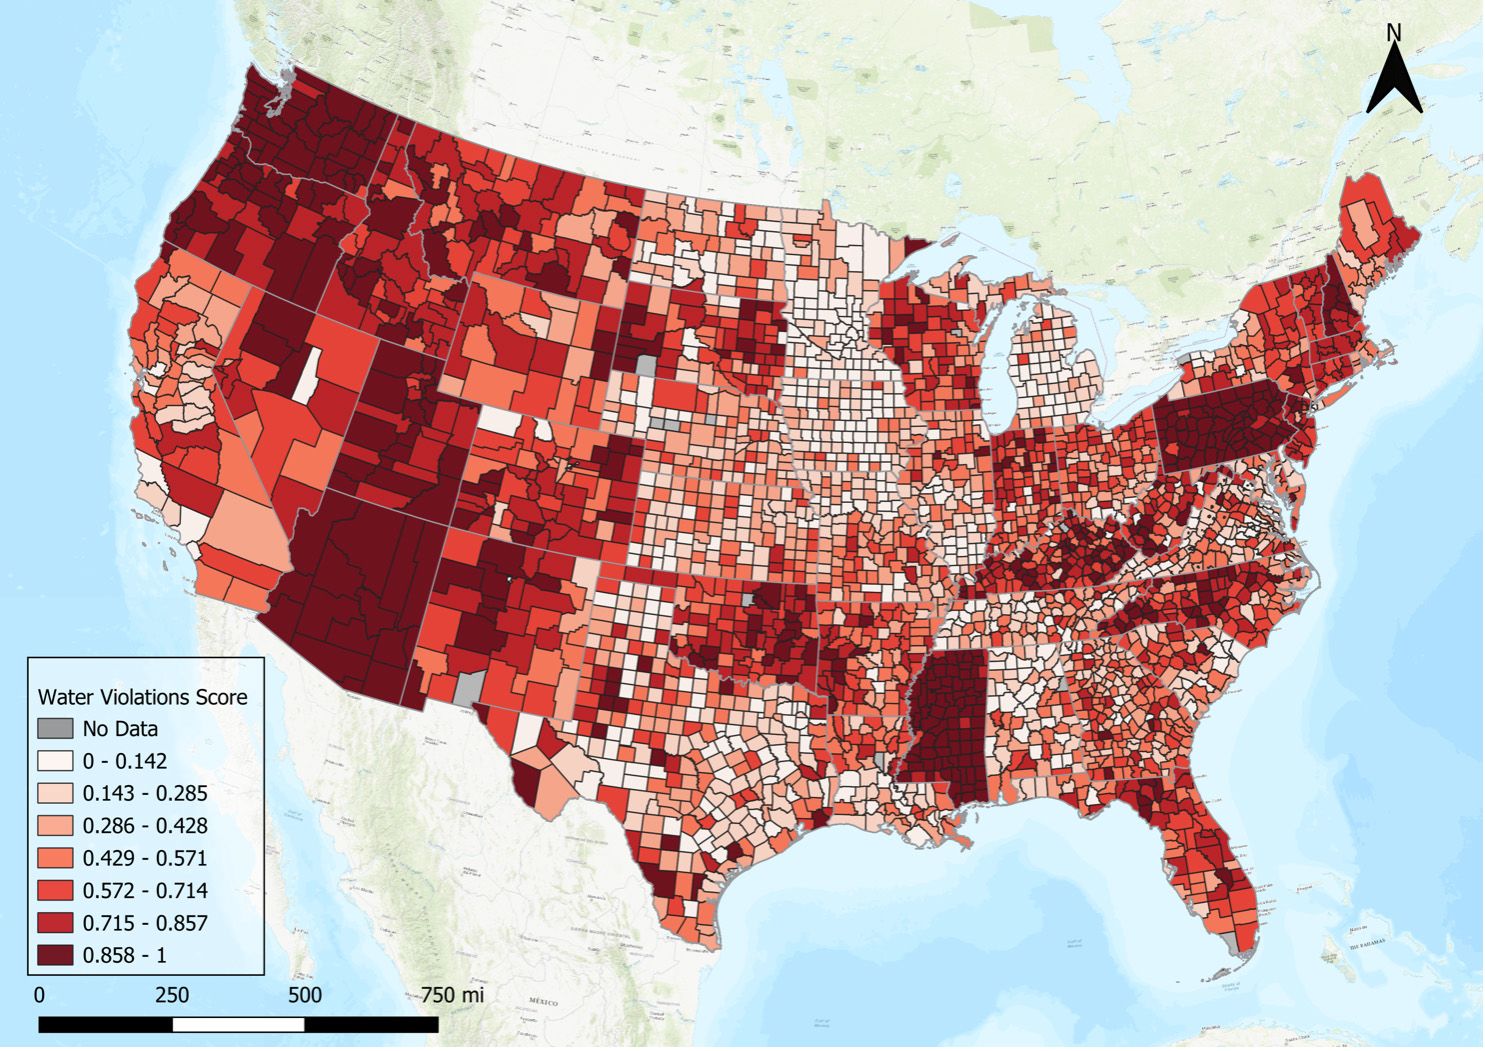
Water violation scores by U.S. county. Scores represent percentiles; thus, counties in the highest percentile ranking have a water violation score higher than 85.8 percent of all other counties in the United States. Source: EPA SDWIS (2019).
Water violation scores by U.S. county. Scores represent percentiles; thus, counties in the highest percentile ranking have a water violation score higher than 85.8 percent of all other counties in the United States. Source: EPA SDWIS (2019).


Water injustice scores by U.S. county. Source: EPA SDWIS (2019), Centers for Disease Control and Prevention and Agency for Toxic Substances Disease Registry (2022)
Water injustice scores by U.S. county. Source: EPA SDWIS (2019), Centers for Disease Control and Prevention and Agency for Toxic Substances Disease Registry (2022)
Areas of water injustice were also more often located where system private ownership was lower, suggesting that public water systems might not necessarily be better at preventing water quality infringements. People living in counties with high water injustice and a greater proportion of privatized systems expressed more concern about their access and the security of clean drinking water.
“Our results suggest that privatization alone is not a solution,” Segrè Cohen said. “The local context, such as regulatory enforcement, community vulnerability and community priorities, matters in determining outcomes.”
The study highlights the importance of socioeconomic and geographic considerations in analyzing access to quality drinking water, Segrè Cohen said, because water system violations alone do not indicate whether residents already face systemic barriers to clean water.