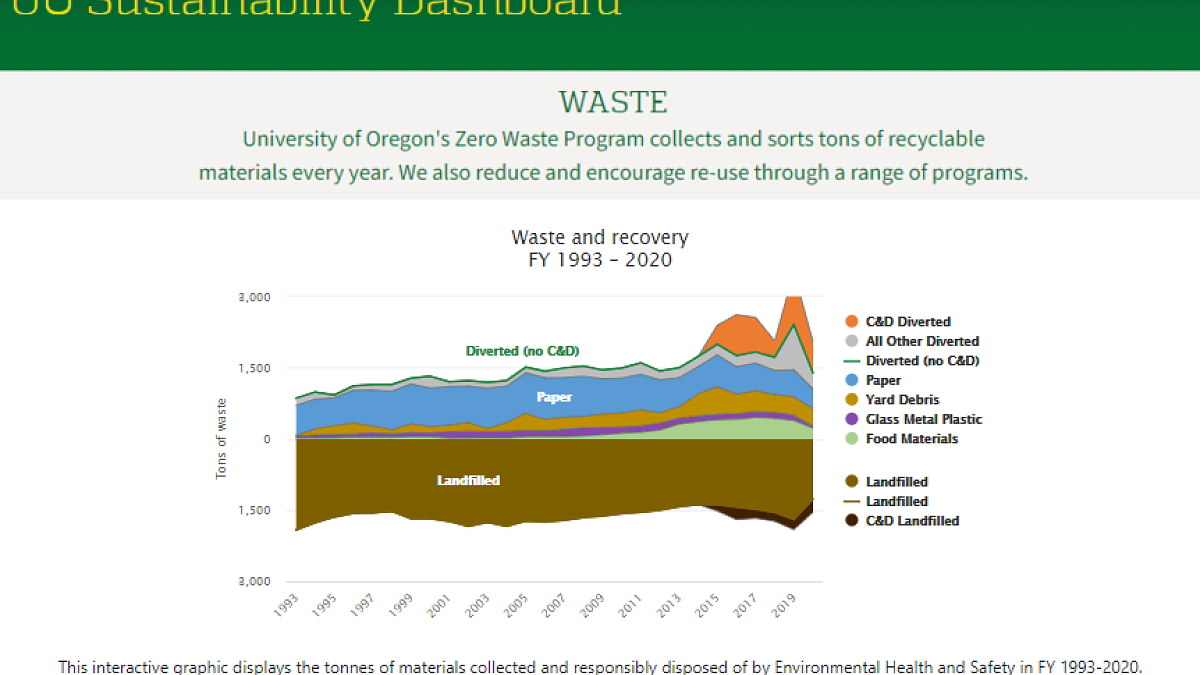
The University of Oregon’s Office of Sustainability released a new online sustainability dashboard, a data sharing and transparency site that showcases the university’s sustainability performance in categories including electricity, purchasing, transportation and waste.
The site features interactive graphics that users can explore to learn about the university’s sustainability performance over the last decade. This first phase of the dashboard focuses on operational sustainability. Site visitors can explore the LEED-certified buildings on campus, track the flow of campus water use and dig into the UO’s greenhouse gas emissions.
“The sustainability dashboard takes this information beyond the sustainability office and out to the whole community,” said Steve Mital, director of the Office of Sustainability. “Not only will this site increase transparency and accountability for sustainability performance at UO, I invite faculty and students to use the data for research and project-based learning.”
The website is organized around the categories in the Sustainability Tracking, Assessment and Rating System, managed by the Association for the Advancement of Sustainability in Higher Education. In March 2020, the UO renewed its certification, achieving a gold rating for the second time.
Designed in collaboration with the UO’s InfoGraphics Lab, the sustainability dashboard features the work of several students who enhanced their professional skills on the project from digital development to communication and client engagement. Roane Mullins, a senior studying spatial data and technology, geography and anthropology, took on much of the responsibility for wrapping up during the past weeks.
“I really enjoyed working with such a great group of people on a project I find meaningful and important,” Mullins said.
Other students who contributed include Lucy Roberts, a sophomore studying spatial data science and technology and global health, as well as recent graduates Julia Olson, spatial data science and technology and environmental studies, and Jacob Maurer, spatial data science and technology and geography.
The next phase of the dashboard will focus on the academics category in the rating system, which features the university’s integration of sustainability content into academic courses, undergraduate programs, graduate programs, and research and scholarship.
Further iterations of the dashboard will include data on engagement and planning and administration. In the meantime, people can begin exploring and playing with the operational graphs on the website right away. Questions and feedback can be shared with Cimmeron Gillespie, who handles data reporting and analysis for the Office of Sustainability, via email at cimmeron@uoregon.edu.


